
ICO Report August: Supply surplus weighs on global coffee prices
The ICO composite indicator fell by 6.7% to 96.07 US cents/lb in August 2019, compared to July 2019.
Oversupply is putting downward pressure on prices and the monthly ICO composite indicator has fallen by 13.6% since the high of 111.21 US cents/lb in October 2018 at the start of the coffee year. The ICO composite indicator averaged 96.07 US cents/lb in August 2019, dropping 6.7% from July 2019. The daily composite indicator ranged between a low of 94.29 US cents/lb on 19 August and a high of 97.43 US cents/lb on 8 August.
Prices for all group indicators fell in August 2019. After recovering 4.7% last month, prices for Brazilian Naturals declined by 9.1% to 95.85 US cents/lb as worry over adverse weather dissipated. Other Milds decreased by 6.8% to 126.23 US cents/lb while Colombian Milds fell 6.1% to 129.2 US cents/lb.
Robusta prices decreased by 4.3% to 70.78 US cents/lb, which is the lowest monthly average in the last 12 months. In August, the arbitrage between Arabica and Robusta coffees, as measured on the New York and London futures markets, decreased for the first time in four months to 38.97 US cents/lb, 11.8% lower than in July 2019.
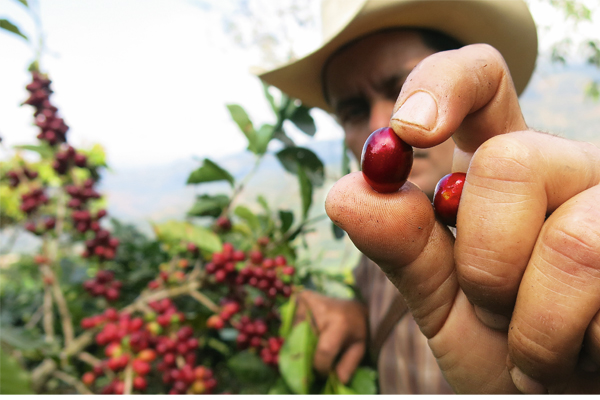
Global production to increase by 3.9%
Global coffee production in coffee year 2018/19 is estimated at 169.73m bags, an increase of 3.9% from 2017/18. Production in South America is estimated 4.9% higher at 81.13m bags. Output from Asia & Oceania is estimated to rise by 4.1% to 48.68m bags, and from Africa to increase by 2.9% to 18.21m bags. Production in Mexico & Central America is estimated just 0.4% higher at 21.72m bags
Global exports rise 10.2% in first ten months of coffee year
In July 2019, world coffee exports rose by 9.5% to 11.34m bags compared to July 2018, supported by ample supplies and higher prices.
Global exports in the first ten months of coffee year 2018/19 (October 2018 – July 2019) grew by 10.2% to 109.41m bags compared to the same period 2017/18. Shipments of Brazilian Naturals rose by 27.6% to 35.08m bags, Colombian Milds increased by 7.6% to 12.59m bags while Robusta exports increased by 6.9% to 38.90m bags. Shipments of Other Milds were 3.7% lower at 22.83m bags.
Green coffee exports represented 91.3% of total exports, amounting to 99.86m bags, soluble coffee shipments accounted for 8.3% (9.06m bags), while roasted coffee shipments represented 0.4% (487,080 bags).
In October 2018 to July 2019, Brazil shipped 31.83m bags of green coffee, 38.4% higher than the same period one year ago, and accounted for around 31.9% of all green coffee shipments. Green coffee exports from Vietnam reached 22m bags, representing 22% of the total, and Colombia’s green coffee exports rose by 7.1% to 10.52m bags. However, green exports from both Honduras and Uganda fell, declining by 2.3% to 6.29m bags and by 3.1% to 3.6m bags, respectively.
The main destinations for green coffee were the United States, Germany, Belgium, Italy, and Japan. The total volume shipped to these five countries reached 32.48m bags, accounting for a third (32.5%) of all green exports in October 2018 to July 2019.
Added value in processed coffee
Mexico, Colombia, Vietnam, Brazil, and the Dominican Republic were the five largest exporters of roasted coffee, accounting for 92.7% of total roasted coffee exports. The United States was the main destination for shipments of roasted coffee, accounting for around 60% of the total during the first ten months of 2018/19.
Brazil was the largest exporter of soluble coffee in October 2018 to July 2019, with shipments reaching 3.29m bags, 10.7% higher than the same period one year ago. Soluble exports from Vietnam rose by 48% to 1.06m bags. There were declines elsewhere – India exported 10.3% fewer bags at 1.59m bags, Indonesia’s shipments declined by 20.5% to 990,279 bags while Mexico’s soluble exports fell by 6.5% to 674,988 bags. The United States, the Russian Federation, the Philippines, Germany and Poland were the main destinations for soluble shipments.
While the share of processed coffee has not changed much in the last three decades, processing coffee at origin can add value, as evidenced by the higher unit values for processed coffee compared to those for green coffee. For example, processing green coffee can double the unit value for Brazil’s exports, while the unit value for Colombia’s processed coffee is around 60-75% greater than those for green coffee.
Coffee consumption in 2018/19 is estimated to rise by 2.1% to 164.77 million bags, which is in line with the average annual growth rate of 2.2% over the last two decades.
Given the greater growth in production compared to consumption, 2018/19 is expected to end in a surplus of 4.96 million bags. Coffee year 2017/18 also ended in surplus. The cumulative oversupply over the last two seasons is estimated at 7 million bags, which is one of the main reasons for current low coffee price levels.
Topics